
The rental market for single-family homes (SFH) continues to experience significant changes in 2023 Q1 compared to the previous quarters. In this report, we will compare the data for Q1 2023 with Q4 2022 and Q1 2022 to give a comprehensive overview of the market. We have analyzed the data for listed rentals, rentals, and leased activity based on the number of bedrooms, rent range, and zip code along with my overall assessment.
Spoiler alert you have 2 choices. Higher rent and longer days on the market or lower rent and shorter days on market. Our hot take . . . drop the rent and minimize vacancy days.
2023 Q1 vs 2022 Q1 vs 2022 Q4 - New Listings
| 2023 Q1 | 2023 Q1 vs 2022 Q1 | 2022 Q1 | ||
| 1171 | 47.85% | 792 | ||
| 1 Bed | 96 | 84.62% | 1 Bed | 52 |
| 2 Bed | 277 | 63.91% | 2 Bed | 169 |
| 3 Bed | 646 | 38.33% | 3 Bed | 467 |
| 4 Bed | 145 | 43.56% | 4 Bed | 101 |
| 5+ Bed | 7 | 133.33% | 5+ Bed | 3 |
| 2023 Q1 | 2023 Q1 vs 2022 Q4 | 2022 Q4 | ||
| 1171 | 82.12% | 643 | ||
| 1 Bed | 96 | 104.26% | 1 Bed | 47 |
| 2 Bed | 277 | 88.44% | 2 Bed | 147 |
| 3 Bed | 646 | 65.64% | 3 Bed | 390 |
| 4 Bed | 145 | 150.00% | 4 Bed | 58 |
| 5+ Bed | 7 | 600.00% | 5+ Bed | 1 |
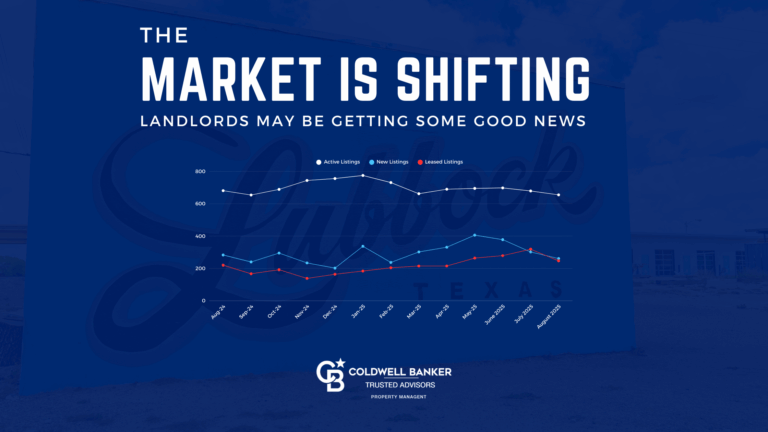
Listing activity from 2022 Q1 is up by 47.85%. However, the real comparison is from 2022 Q4. We have taken over 80% more listings.
2023 Q1 vs 2022 Q1 vs 2022 Q4 - Rented
| 2023 Q1 | 2023 Q1 vs 2022 Q1 | 2022 Q1 | ||
| 717 | 54.19% | 465 | ||
| Average Rent | $1,318.00 | 0.30% | Average Rent | $1,314.00 |
| Avg Dpsqft | $1.00 | 5.26% | Avg Dpsqft | $0.95 |
| Average DOM | 61 | 41.86% | Average DOM | 43 |
| Average Age | 1983 | Average Age | 1982 | |
| Average Square Footage | 1373 | Average Square Footage | 1479 |
| 2023 Q1 | 2023 Q1 vs 2022 Q4 | 2022 Q4 | ||
| 717 | 54.86% | 463 | ||
| Average Rent | $1,318.00 | 2.33% | Average Rent | $1,288.00 |
| Avg Dpsqft | $1.00 | 5.26% | Avg Dpsqft | $0.95 |
| Average DOM | 61 | -1.61% | Average DOM | 62 |
| Average Age | 1983 | -0.10% | Average Age | 1985 |
| Average Square Footage | 1373 | -2.62% | Avearege Square Footage | 1410 |
The total number of rented listings increased by 54% from 2022 Q4 to 2023 Q1. This also aligns with the same number of leased properties from 2022 Q1. However, the biggest take is the amount of increase from 2022 Q4. While the increase is great, it does not match the number of listings taken. Ideally, you want the same increase as the number of listings taken. This points to a more saturated rental market for 2023.
2023 Q1 vs 2022 Q1 vs 2022 Q4 - Rented by Room Count
| Bedrooms | 2023 Q1 Count | 2023 Q1Avg Rent | 2023 Q1 DOM | 2022 Q4 Count | 2022 Q4 Avg Rent | 2022 Q4 DOM | 2022 Q1 Count | 2022 Q1 Avg Rent | 2022 Q1 DOM | Dollar Per Square Foot | Avg year Built | Avg SqFt | Per Room |
| 1 | 52 | $617 | 41 | 27 | $642.00 | 84 | 20 | $595.00 | 68 | $1.07 | 1962 | 587 | $617 |
| 2 | 155 | $982 | 43 | 115 | $926.00 | 50 | 120 | $951.00 | 50 | $0.95 | 1972 | 1062 | $491 |
| 3 | 432 | $1,668 | 62 | 266 | $1,394.00 | 63 | 277 | $1,407.00 | 39 | $1.14 | 1991 | 1492 | $556 |
| 4 | 77 | $1,955 | 62 | 54 | $1,847.00 | 74 | 46 | $2,000.00 | 37 | $1.26 | 1976 | 1848 | $489 |
| 5+ | 1 | $1,550 | 33 | 1 | $2,000.00 | 80 | 2 | $1,800.00 | 37 | $0.97 | 1971 | 1595 |
3 bedroom has seen a significant rent increase from 2022 Q4, and the DOM is virtually the same. However, compared to 2022 Q1, the DOM is 58% longer. For all 2022 the average DOM was 45, but when you look at 2022 Q4, you can see there was a significant shift in DOM. This most likely was a result of a slower time of the year, but also there was a significant amount of inventory that we entered the market in the last 6 months of 2022. A lot of that inventory is still on the market.
2 bedrooms homes showed to have a decent rent increase from 2022 Q4. This is likely an effect of college leasing. 2022 Q1 rent average was higher than 2022 Q4.
Overall Assessment
Overall, rent values are holding. However, with longer days on the market, profitability is decreasing. Longer DOM is another way of saying falling rent prices. Currently, listing activity points to the rental market softening. The second quarter is typically the busiest, and if days on the market don’t start coming down, you could see rent rates falling and longer days on the market.
Do not forgo keeping your rentals updated and clean. Even if rents decline, properties that look sharp and are in good condition will always get top dollar. In the absence of value, you will always be judged on price. When properties don’t lease out, it is only for two reasons. Price or Condition. Do everything you can to eliminate condition issues.
Keeping rentals profitable is a fickle business. Between repairs, tenant issues, market issues, pandemics, and inflation, something always affects your bottom dollar. But vacancy is the most expensive thing that can happen to you. While it may seem counterintuitive, reducing rent rates may make you more money.
2023 Q1 Rental Amounts
| Rent Range | 2023 Q1 Count | 2023 Q1Avg Rent | 2023 Q1 DOM | Median Rent | Avg Age | DPSQFT | Avg Sqft | Avg Bed |
| <750 | 86 | $623 | 54 | $650 | 1962 | $0.95 | 692 | 1 |
| 750-900 | 54 | $858 | 49 | $875 | 1959 | $0.88 | 1064 | 2 |
| 901-1000 | 38 | $971 | 42 | $975 | 1966 | $0.92 | 1094 | 2 |
| 1001-1200 | 98 | $1,127 | 53 | $1,100 | 1972 | $0.96 | 1208 | 3 |
| 1201-1300 | 99 | $1,277 | 75 | $1,295 | 1994 | $0.96 | 1356 | 3 |
| 1301-1400 | 77 | $1,372 | 72 | $1,375 | 1997 | $0.96 | 1454 | 3 |
| 1401-1500 | 83 | $1,479 | 62 | $1,495 | 2002 | $0.97 | 1556 | 3 |
| 1501-1600 | 45 | $1,570 | 81 | $1,575 | 1993 | $0.96 | 1663 | 3 |
| 1601-1800 | 57 | $1,722 | 57 | $1,700 | 1993 | $1.03 | 1840 | 3 |
| 1801-2000 | 36 | $1,917 | 59 | $1,900 | 1988 | $1.12 | 1749 | 3 |
| 2001-2200 | 13 | $2,152 | 35 | $2,200 | 1992 | $1.12 | 1983 | 4 |
| 2201-2500 | 14 | $2,364 | 84 | $2,400 | 1979 | $1.10 | 2182 | 4 |
| 2501-2750 | 12 | $2,629 | 59 | $2,600 | 1976 | $1.39 | 2012 | 4 |
| $2750+ | 5 | $2,800 | 17 | $2,800 | 1954 | $1.28 | 2201 | 4 |
2023 Q1 Rented by Zip Code
| Zip Code | 2023 Q1 Count | 2023 Q1Avg Rent | 2023 Q1 DOM | Median Rent | Avg Age | DPSQFT | Avg Sqft | Avg Bed |
| 79424 | 99 | $1,611.00 | 55 | $1,500.00 | 2005 | $0.98 | 1662 | 3 |
| 79410 | 66 | $1,448.00 | 57 | $1,300.00 | 1952 | $1.08 | 1328 | 3 |
| 79407 | 51 | $1,426.00 | 61 | $1,350.00 | 1999 | $1.34 | 1322 | 3 |
| 79416 | 94 | $1,350.00 | 85 | $1,400.00 | 1996 | $0.95 | 1435 | 3 |
| 79423 | 124 | $1,333.00 | 50 | $1,300.00 | 2002 | $0.96 | 1433 | 3 |
| 79413 | 69 | $1,255.00 | 46 | $1,175.00 | 1960 | $0.92 | 1405 | 3 |
| 79414 | 60 | $1,154.00 | 61 | $1,125.00 | 1955 | $0.95 | 1236 | 3 |
| 79411 | 42 | $1,000.00 | 51 | $925.00 | 1946 | $1.00 | 1055 | 2 |
| 79415 | 14 | $960.00 | 49 | $860.00 | 1970 | $0.99 | 974 | 2 |
| 79412 | 20 | $941.00 | 57 | $850.00 | 1959 | $0.85 | 1159 | 2 |